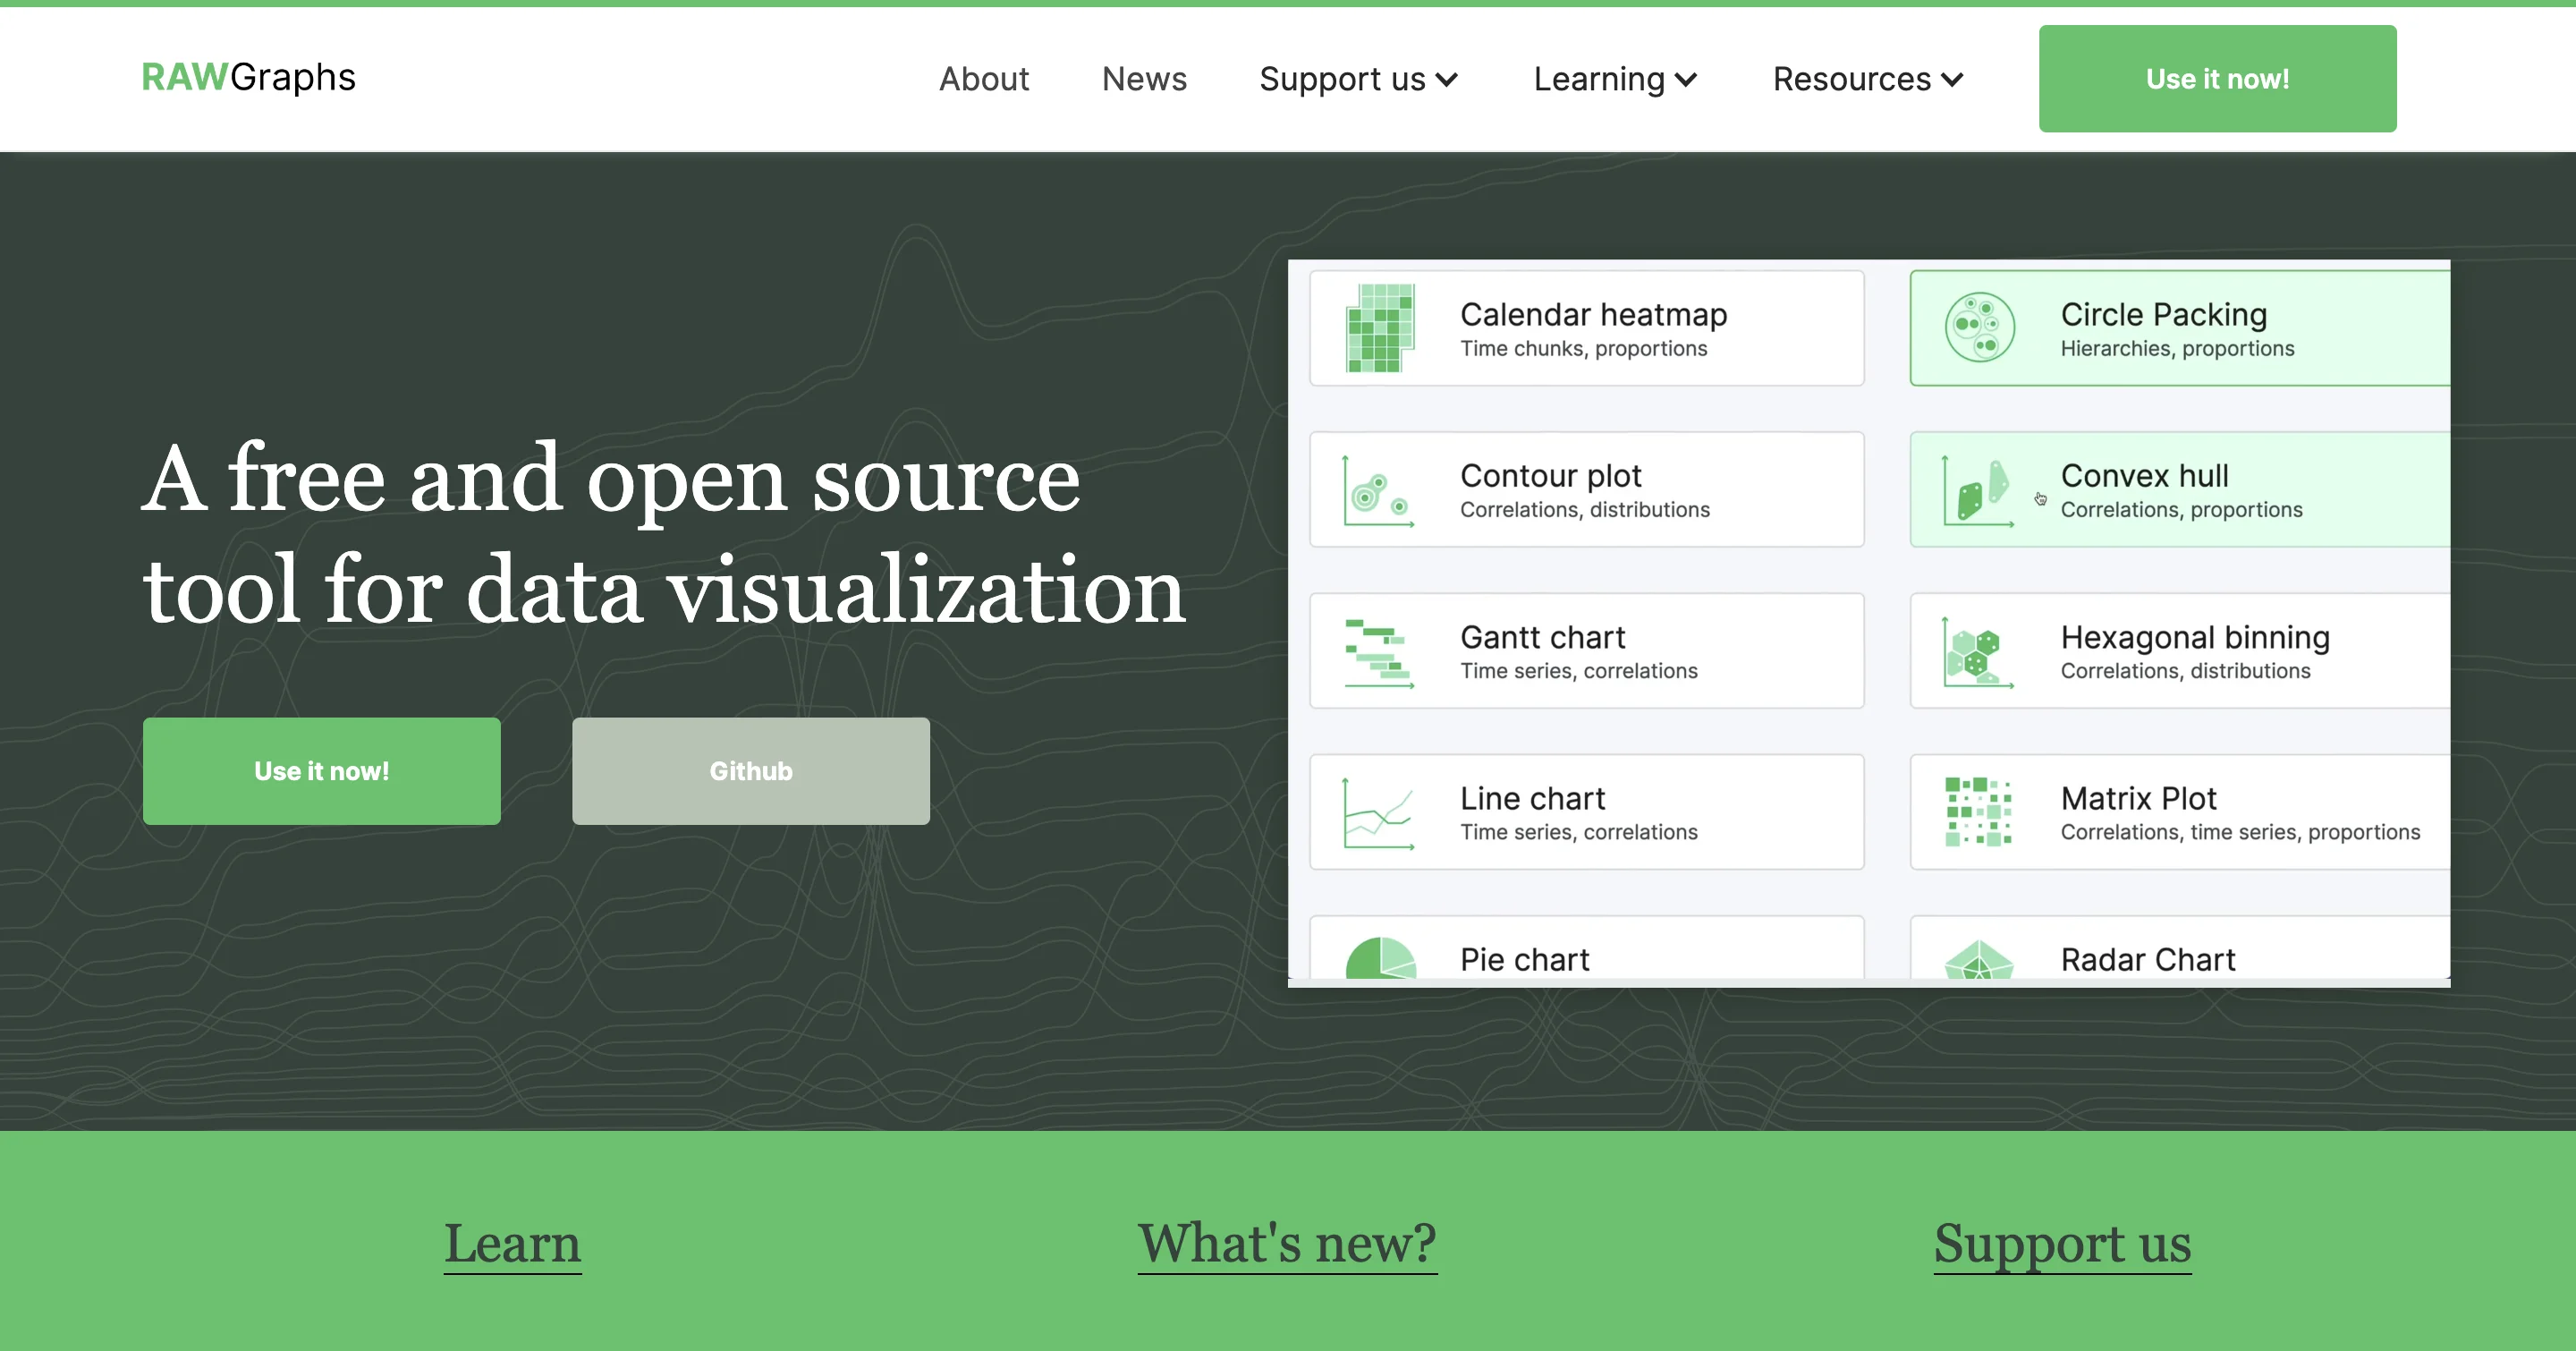
RAWGraphs 2.0 is an open source data visualization framework created with the aim of making the visual representation of complex datasets easy for everyone. Initially conceived as a tool for designers and enthusiasts in the field, RAWGraphs aims to provide the missing link between spreadsheet applications (Microsoft Excel, OpenRefine) and vector graphics processing software (Illustrator, Sketch).
Inmagik is part of the project development team together with DensityDesign and Studio Calibro, with which a crowdfunding campaign was finalized and led to the release of version 2.0 in early 2021.
Inmagik is mainly involved in the implementation of the web application and other software components of the project.
Dataset: the software allows you to upload your dataset (which is guaranteed to be completely confidential) and, as soon as the data set dimensions are mapped, the corresponding display appears. To manipulate it, you can map its dimensions with the visual variables of the layout or insert another dataset for a new view.
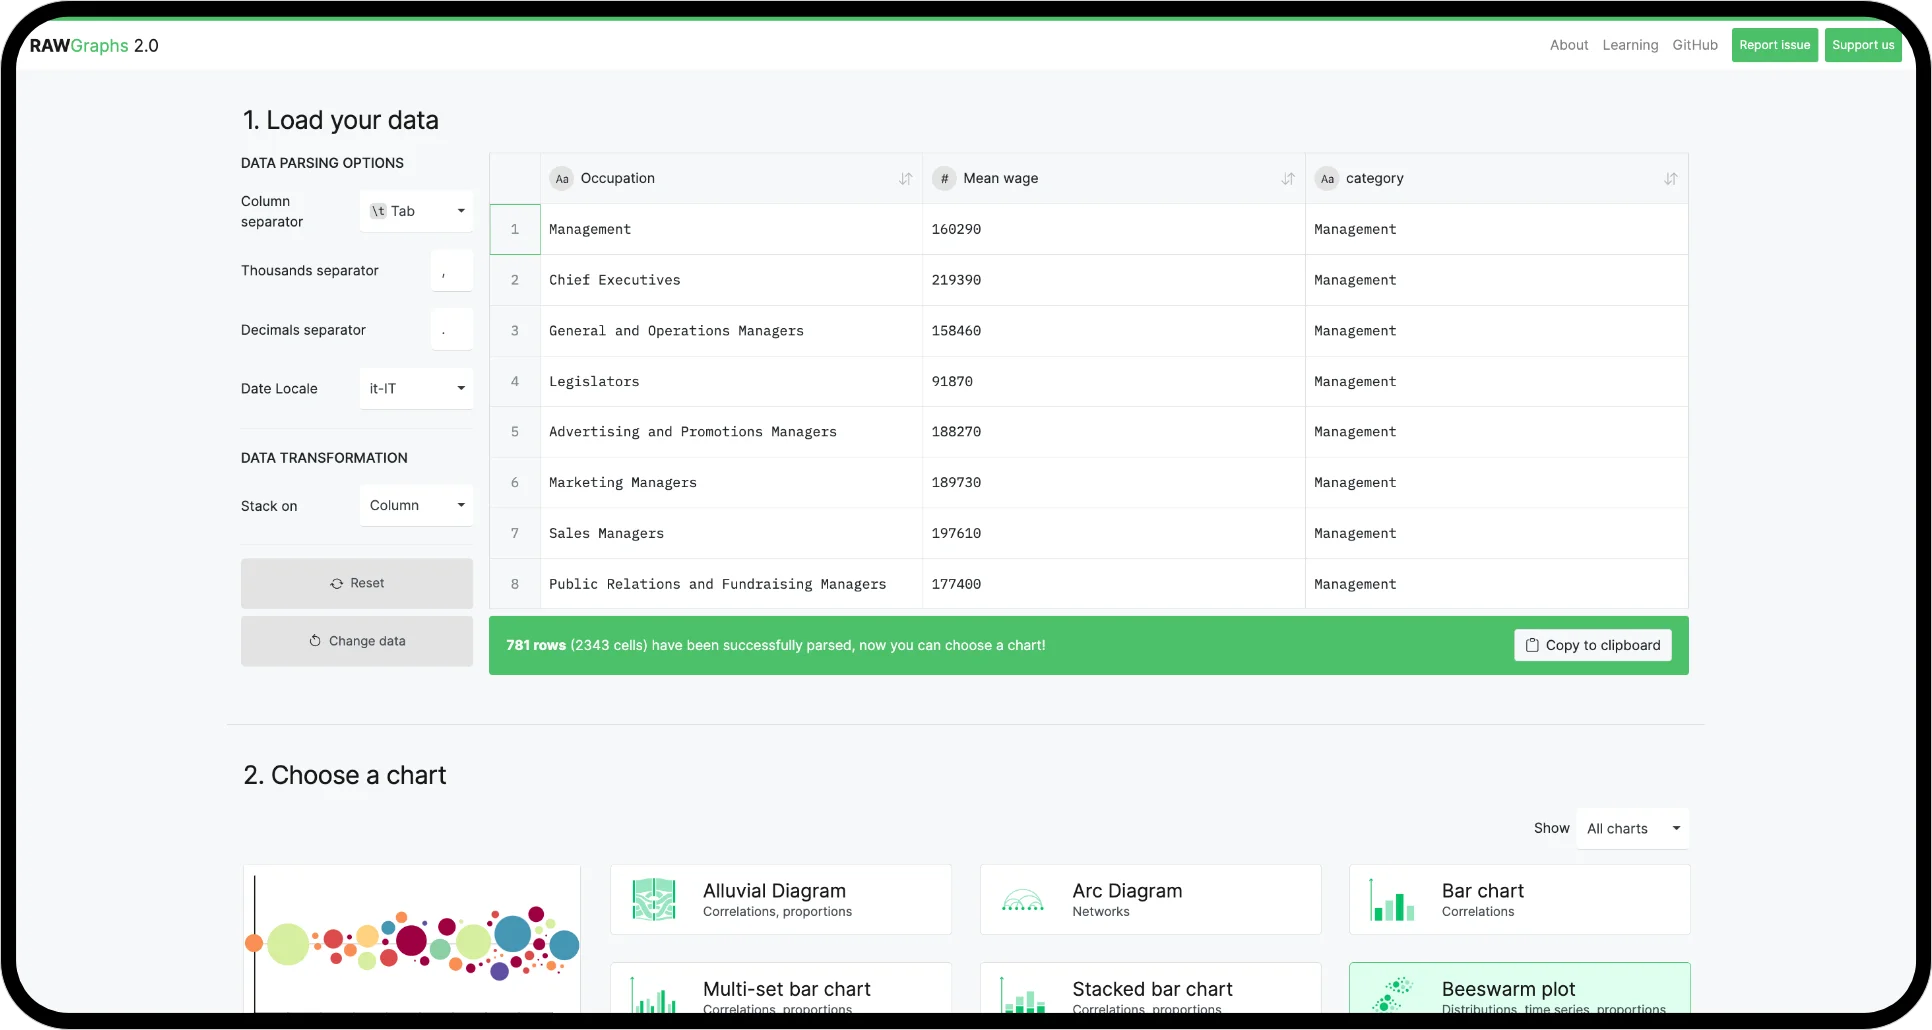
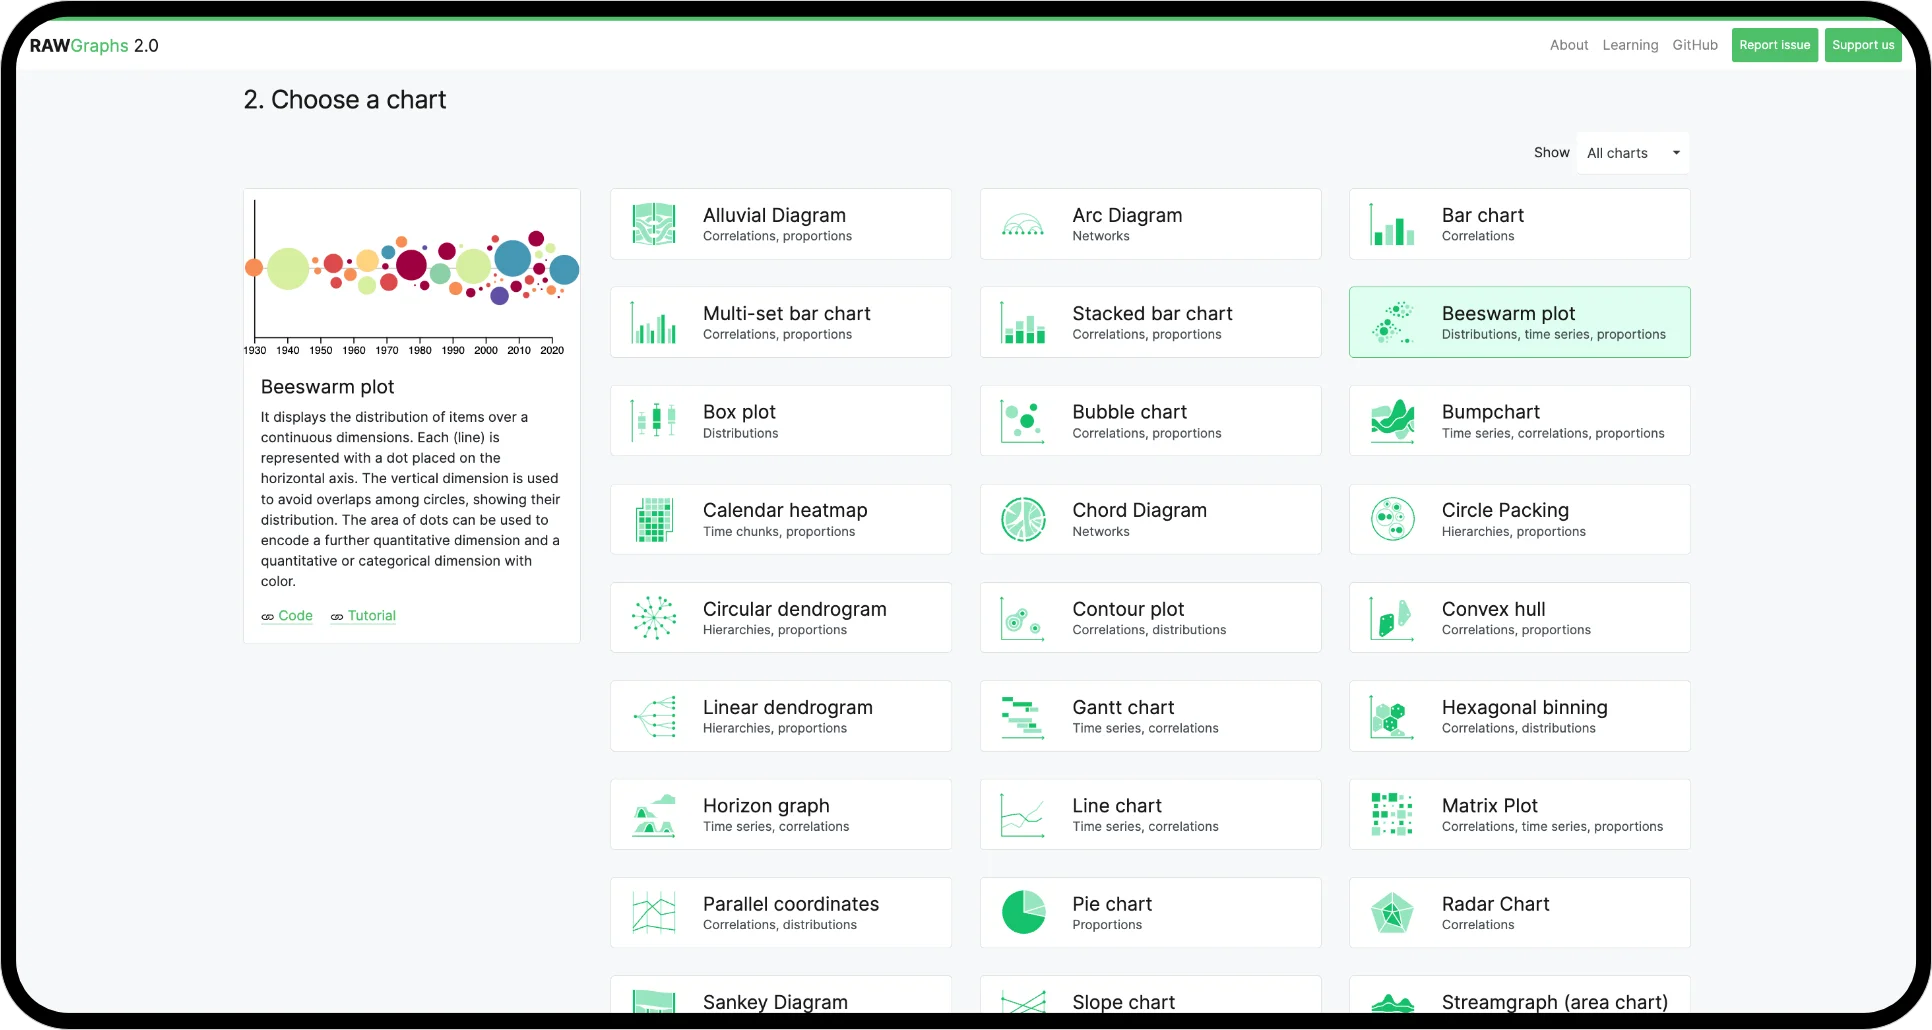
Charts: you can use almost 30 visual templates to display quantities, hierarchies, time series and find information in the data, as well as upload custom charts.
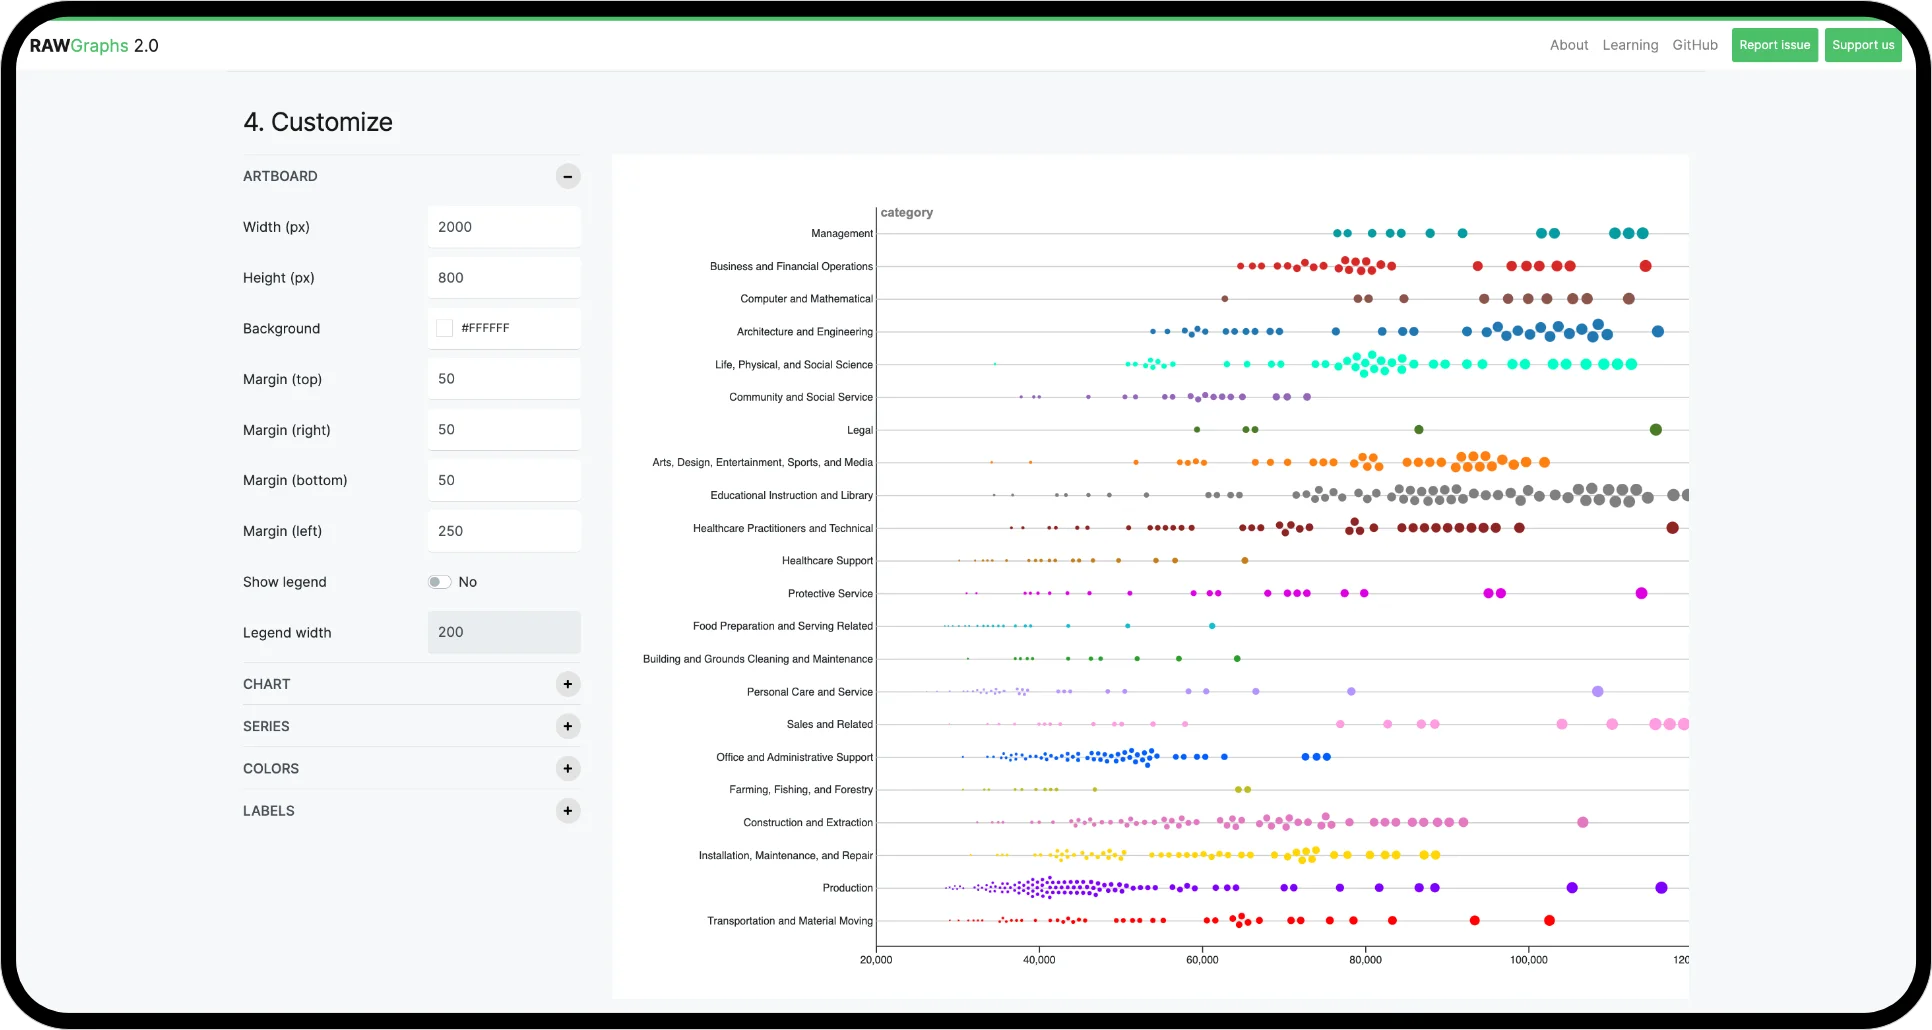
Mapping & Customize: once you have chosen the chart type to use, you can assign the data set size to the variables in the chart in a simple and intuitive way. After that, you can customize the chart as both sizes and colors and labels.
Export: RAWGraphs allows you to export the views as vector images (SVG) or raster images (PNG) and embed them into your web page. To edit them, just open the files in a vector graphics editor.